Bad-Graph
Mid Project 01 : Redesigns of Graphical Representation
By : MANO HARSHA SAPPA
Misleading Chart:
While perusing the latest United States government chart titled “Immigrant Visa Number Use by Category Fiscal Year 2014,” two pivotal columns, namely “Visa Issuances at Office Abroad” and “USCIS Adjustment,” delineate the distribution of immigrant visas across distinct categories. The comprehensive breakdown includes visas designated as F1, F2A, F2B, F3, F4, E1, E2, E3, E4, E5, and DV. This chart provides a comprehensive snapshot of the allocation and utilization of immigrant visas within the specified fiscal year.
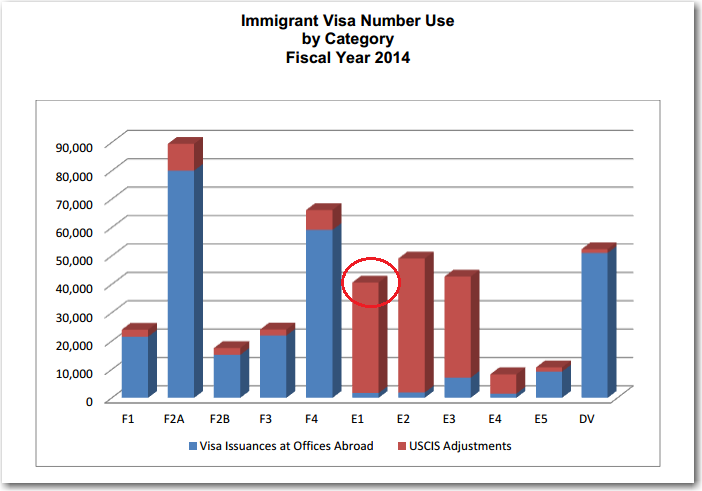
Fig1: Misleading 3D Graph in the United States Government’s 2014 Immigration Visa..
Flaws in the Original Graph:
- Unnecessary 3D Effect : The 3D view of the graph makes it appear a bit weird. It’s like looking at things from an odd angle, making it hard to figure out the real heights of the bars.
- Confusing E1 Visa Number: The E1 visa bar is placed close to a line marking 40,000, and because of the 3D view, it’s tricky to tell if it’s above or below that line. This can lead to misunderstandings.
- Too Much Stuff: The 3D stuff like shadows and angles makes the graph messy. It’s like having too many decorations that don’t really help us understand the information better.
Graph Improvement Steps:
- Shift to 2D Format: Change the original 3D graph to a straightforward 2D bar chart. This simplification removes unnecessary visual complexity, making it easier for viewers to grasp the data accurately without any distortions.
- Side-by-Side Columns: Instead of having a single bar spanning two columns, use the “position = dodge” feature to display the columns side by side. This adjustment enhances visual clarity, allowing viewers to effortlessly compare the two categories.
- Incorporate bublle Plot for Pattern Analysis: Integrate a bubble plot alongside the bar chart to uncover underlying patterns and trends within the data. Scatter plots are effective tools for highlighting relationships between variables, providing an additional visual element that enhances the audience’s understanding.